State of Government Debt: Fourth Quarter 2026
Governments around the world owe about $119.04 trillion, on this site’s model of the IMF’s figures, about 94% of world GDP and about $14,697 for every person on earth. The total grows by about $293,799 a second, or $25.4 billion a day: $983.2 billion since the quarter began on October 1, 2026.
This report covers all 194 economies the IMF reports. It is a dated snapshot: its figures are fixed as of the date above, while the live counters keep moving. Every table and chart can be reused with credit.
Five things to know
- On the current IMF vintage, world debt passed $112 trillion on February 4, 2026; $113 trillion on March 15, 2026; $114 trillion on April 24, 2026; $115 trillion on June 2, 2026; $116 trillion on July 11, 2026; $117 trillion on August 20, 2026; $118 trillion on September 28, 2026; $119 trillion on November 7, 2026. The next, $120 trillion, is due on or about December 16, 2026.
- Two borrowers dominate the growth. China ($99,328 a second) and the United States ($79,753) together add 61% of each new dollar of world government debt.
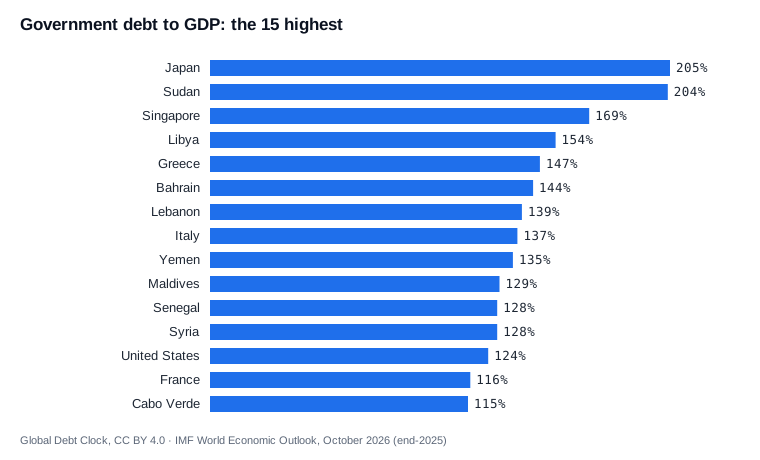
- 24 of the 194 governments owe more than their annual GDP. Japan has the highest ratio, at 205%.
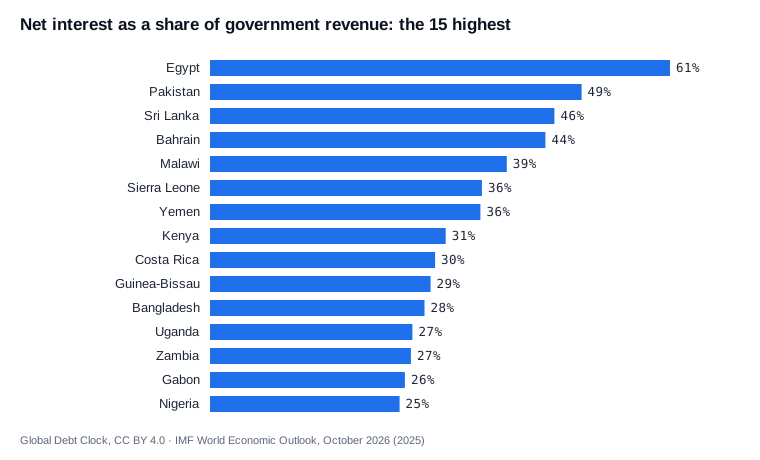
- Interest takes a large share of some budgets. Egypt spends about 61% of its revenue on net interest, and 15 governments spend at least a quarter. The US Treasury’s interest to the public was $1.07 trillion in fiscal 2026.
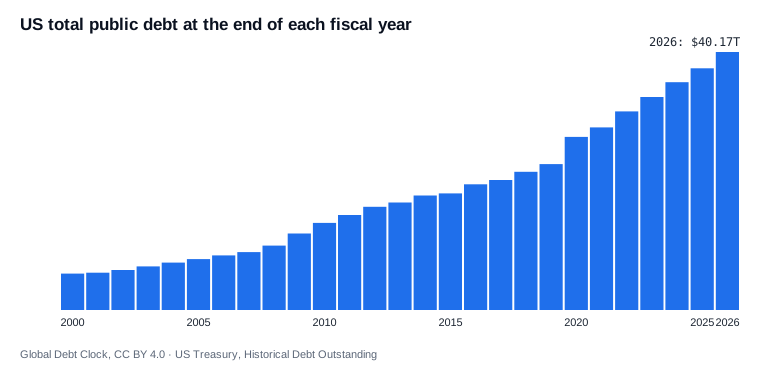
- The US debt limit. Debt subject to the limit was $40.36 trillion on November 5, 2026, against a limit of $41.10 trillion, leaving $746.7 billion of room. Total public debt was $40.56 trillion at the close of November 5, 2026, up $384.3 billion since the last close before the quarter began.
The largest government debts
| Country | Debt now | Share of world | Debt to GDP |
|---|---|---|---|
| United States | $40.66T | 34.2% | 124% |
| China | $22.03T | 18.5% | 99% |
| Japan | $8.72T | 7.3% | 205% |
| United Kingdom | $4.31T | 3.6% | 102% |
| France | $4.17T | 3.5% | 116% |
| Italy | $3.69T | 3.1% | 137% |
| Germany | $3.48T | 2.9% | 63% |
| India | $3.36T | 2.8% | 84% |
| Canada | $2.84T | 2.4% | 114% |
| Brazil | $2.51T | 2.1% | 93% |
The highest debt-to-GDP ratios
The biggest rises since 2019
Change in debt to GDP from the end of 2019, the last year before the pandemic, to the end of 2025, in percentage points. IMF figures.
| Country | 2019 | 2025 | Change |
|---|---|---|---|
| Ukraine | 50.5% | 107% | +57 |
| Malawi | 41.2% | 97% | +56 |
| Maldives | 77.2% | 129% | +52 |
| Senegal | 79.5% | 128% | +49 |
| Bahrain | 97.1% | 144% | +47 |
| Libya | 110.3% | 154% | +44 |
| Singapore | 127.7% | 169% | +41 |
| Saint Vincent and the Grenadines | 68.0% | 108% | +40 |
| China | 60.0% | 99% | +39 |
| Bolivia | 48.9% | 83% | +34 |
Who spends the most on interest
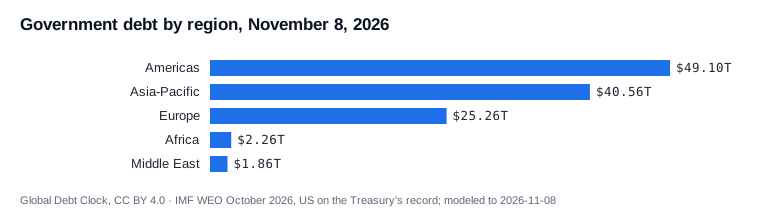
By region
The United States
See also the US debt on any date since 1790, the debt-limit tracker and interest on the debt.
Data and methods
Debt for 190 of the 194 economies is the IMF’s general government gross debt from the World Economic Outlook, October 2026, at the end of 2025, grown at the IMF’s projected 2026 rate. For Afghanistan, Ecuador, Lebanon, Senegal and West Bank and Gaza the October edition has no 2026 projection, so they are held at the end-2025 figure. The US is on the Treasury’s daily record, and Somalia, Syria and Yemen are on IMF and World Bank country documents (Syria and Yemen held at the latest reported figure). Ratios are the IMF’s. Full method: methodology. How the US counter tracks the record: accuracy. All 194 rows: CSV.
Cite as: Global Debt Clock, “State of Government Debt: Fourth Quarter 2026,” November 8, 2026, https://www.global-debt-clock.com/reports/2026-q4/. Text, tables and charts are free to reuse under CC BY 4.0.