Free, citable government-debt data — built to be used.
Everything here is free to embed, cite, and republish with attribution. Figures follow the IMF World Economic Outlook (general government gross debt), are reviewed twice a year, and every number is reproducible to a timestamp.
1 Cite a figure
Pick a country, then copy a ready-to-paste citation. Each one includes a reproducible snapshot URL that locks the exact number to a timestamp, so an editor or fact-checker can verify it later.
2 Embed a live counter
Drop a live, self-updating debt counter into any article or page. Works anywhere iframes are allowed. Free on any website, including ad-supported news sites, as long as the attribution link stays; contact us to use it without the link or inside an app.
3 Ready-made share cards
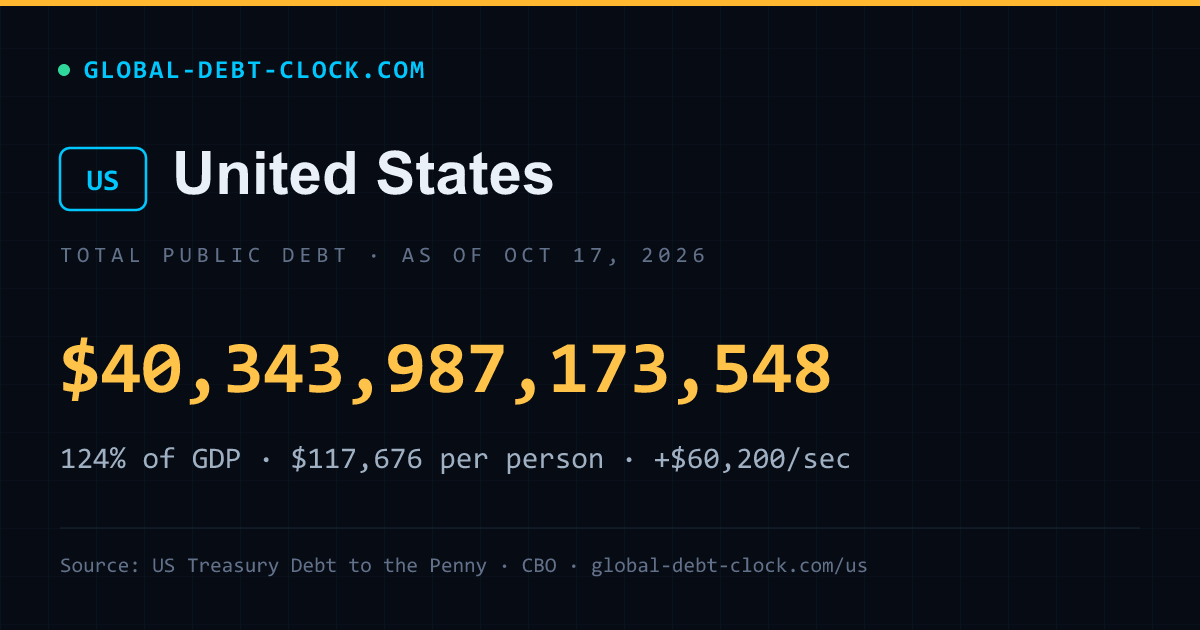
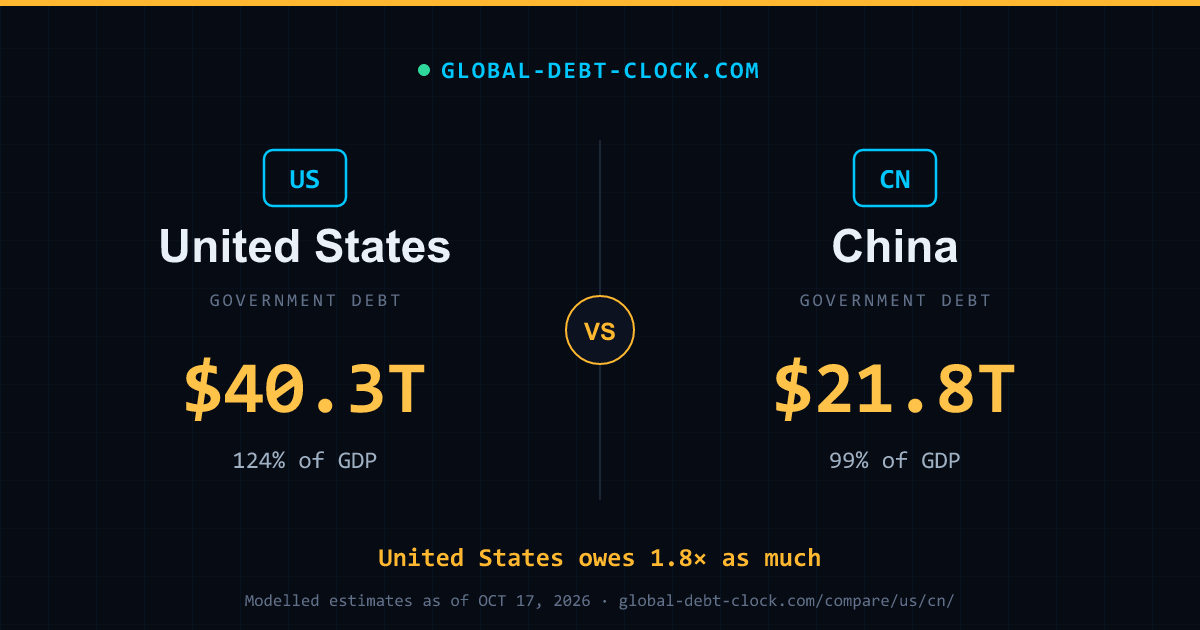
Every country and every country-vs-country comparison has a 1200×630 social card. Share the page URL and it appears automatically — or hot-link the image directly.
4 Use the API
A free, open REST API — no key, CORS enabled, attribution appreciated. Full spec: OpenAPI · llms.txt · MCP.
- GET /api/debt?c={id} — live value for one country (or omit c for all 135 countries plus the EU and world)
- GET /api/debt/snapshot?c={id}&t={iso} — reproducible point-in-time figure, safe to cite
- GET /api/compare?a={id}&b={id} — side-by-side with deltas
- GET /api/rank?by={field} — pre-sorted rankings (debt, gdpPct, rate, perCapita)
- GET /api/debt/history?c={id} — historical baselines
5 The full dataset
The complete baseline dataset for all 135 countries — names, regions, base figures, growth rates, debt-to-GDP and population — as one JSON file, ideal for analysis or building your own visual.
- /licensing/ — commercial use, attribution waiver, bulk exports
- /changelog/ — dated record of every figure revision
- /statistics/ — citable key statistics with copy-ready citations and sources
- /data/debt.json — full static dataset
- /countries — discovery index (IDs, names, page URLs)
- Need a custom feed or bulk historical export? Get in touch.
6 Methodology & the fine print
Figures are computed by linear extrapolation from IMF general government gross debt baselines (WEO, October 2026) plus national-treasury data, and reviewed twice a year. China is shown on the narrow general-government basis; the US uses the closely comparable US Treasury total-public-debt figure. These are educational estimates, not certified accounting totals — actual debt changes through discrete bond issuances. Full detail on the methodology page.
7 Talk to us
Questions about the data, a figure you want verified, an interview, or commercial licensing? Email [email protected]. Attribution as “Global Debt Clock” with a link is appreciated wherever you use the data.